Longyearbyen UHI experiment, 26 January 2008
Open Climate4you homepage
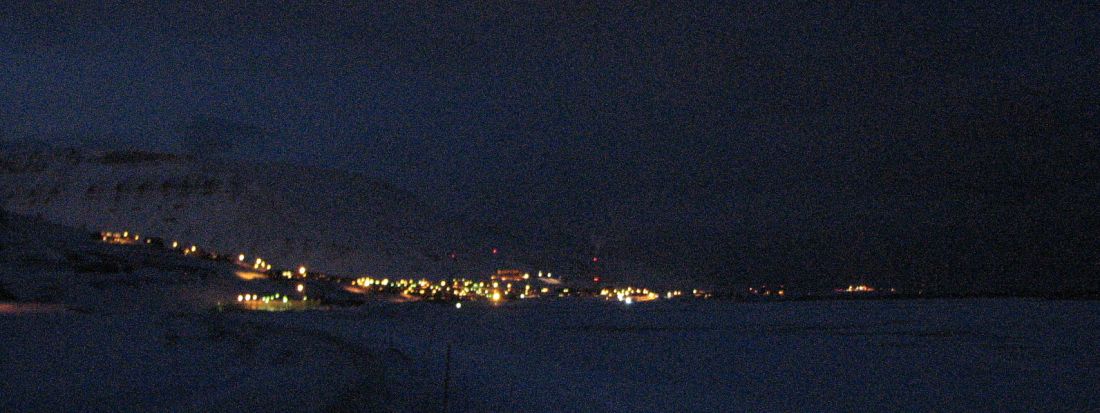
Longyearbyen 26 January 2008 0:40 PM, looking WNW from the northern end of
the lake Isdammen (see map below). The weather is clear, with scattered clouds, and the wind is light from
ESE. The smaller group of lights to the
right in the picture is Svalbard Ariport. Compare with map below.
The general weather
situation, measurement equipment and measurement route
The weather was pleasant with air temperature about -7oC, and dry with scattered clouds. The wind was 3-4 m/s from ESE. The nearby fjord was ice free. A thermistor was attached to the roof of a car (c. 1.5 m above terrain), and temperatures were logged at 2 sec. intervals. The time given in the diagrams below are according to normal winter zonal time. The measurements were carried starting at Svalbard Airport in the upper left of the map below, driving SE along the coast to the town, making a roundtour here, before proceding SE into the lower part of the major valley Adventdalen.
Longyearbyen
is the worlds northernmost town and is located at 78o17'N 11o20'E,
in central
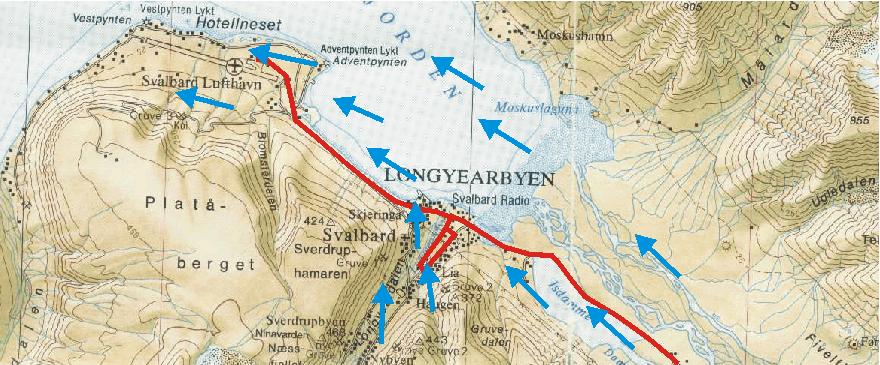
Topographic map showing Longyearbyen and Svalbard Airport (Svalbard Lufthavn). The red line shows the measurement route 26 January 2008, starting at the Airport and ending in the lower part of the valley Adventdalen to the SE. In between, a detour was made in the central part of the town as shown. The wind was 3-4 m/s from ESE (blue arrows), with a small deviation in Longyearvalley. The fjord was ice free. The map section measures c. 11 km west to east.
Results
Result
of temperature measurements along the route Svalbard Airport - Longyearbyen
-Adventdalen, 26 January 2008. The official Svalbard meteorological station is
located at the airport. Se map above for reference.
Interpretation of results
The whole area was snowcovered. The sun was below the horizon, and albedo effects caused by buildings and roads for that reason not important. It was Sunday, and there only few cars on the roads in the village.
The registered air temperatures show an overall falling trend towards SE along the main measurement route. Near the airport, where the official Svalbard meteorological station is located, air temperatures are relatively high (about -6.5oC), which is interpreted as being the result of the onshore airflow from ESE across the ice free fjord. Further towards SE, this local warming effect diminishes, and colder air (about -8.5oC) draining out of the valley Adventdalen dominates. The temperature difference between the Airport and Adventdalen is about 2oC, which presumably represents the open water effect (OWE). In between, the local heat island effect of the town Longyearbyen is only weakly developed. The maximum UHI effect appears to be about +0.5oC at the time of the experiment. The local weak cold trough recorded within Longyearbyen (12:26) corresponds to the main valley axis, where the temperature presumably is influenzed by cold air masses draining from the glacier at the valley head.
The
existence of an urban heat island effect in a relatively small settlement as
Longyearbyen may come as a surprise. This is, however, not the first time this
has been observed in the Arctic; see, e.g., Hinkel
et al. 2003.