Open Climate4you homepage
The North Atlantic Oscillation (NAO)
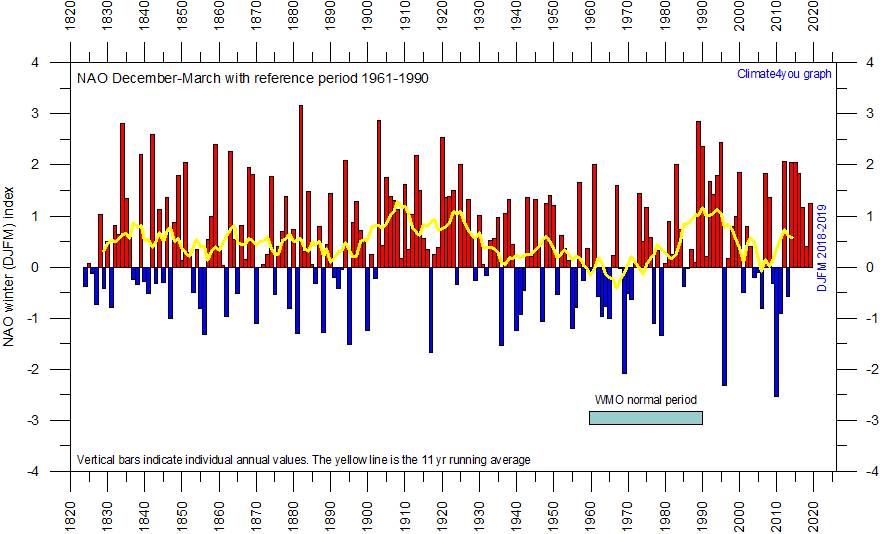
NAO values since 1824, using
the WMO normal period 1961-1990 as base period. This produces an artificial
dominance of years with positive NAO values. The high NAO values characterizing
the period 1990-2000 is however seen not to be unique when the whole data series
is considered.
The
North Atlantic Oscillation (NAO) is the dominant pattern of atmospheric
circulation variability in the
In
general terms, NAO is calculated as the difference of normalised surface
pressure between a station close to the subtropical high area, usually
When
the NAO is in its positive phase, the subtropical high-pressure centre is
stronger than usual and the Icelandic low-pressure centre is deeper. The
positive phase is associated with stronger-than-average westerlies across
mid-latitudes, warm and wet winters in
In
certain years both
Much interest has been attached to variations in NAO since 1990, and global climate models have forecasted high, positive NAO values to characterise the 21st century. The NAO index has, however, since 2000 shown an overall falling trend, but with variations. NAO data may be downloaded by clicking here.
The
NAO index is well
suited to illustrate the visual effect of the base period chosen. Typically, the
WMO normal period 1961-1990 is used as base period, and zero is defined at the average of NAO
index values for this period (see figure
above).
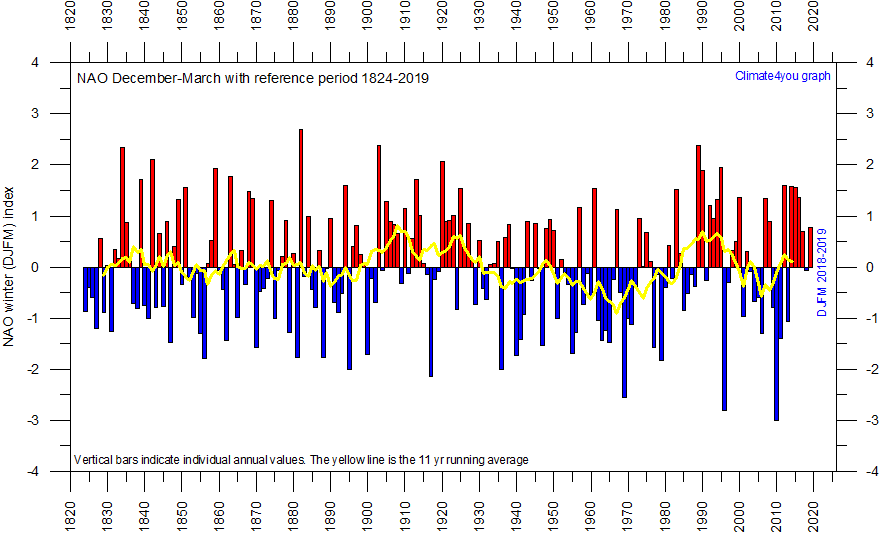
NAO values since 1824, using the longer period 1824-2007 as base period. This corrected diagram shows a realistic balance between years with positive and negative NAO values. Since 2000 there has actually been several years with NAO value below the long-term average (1824-2007). Last update May 23, 2008.
Click here to jump back to the list of contents.
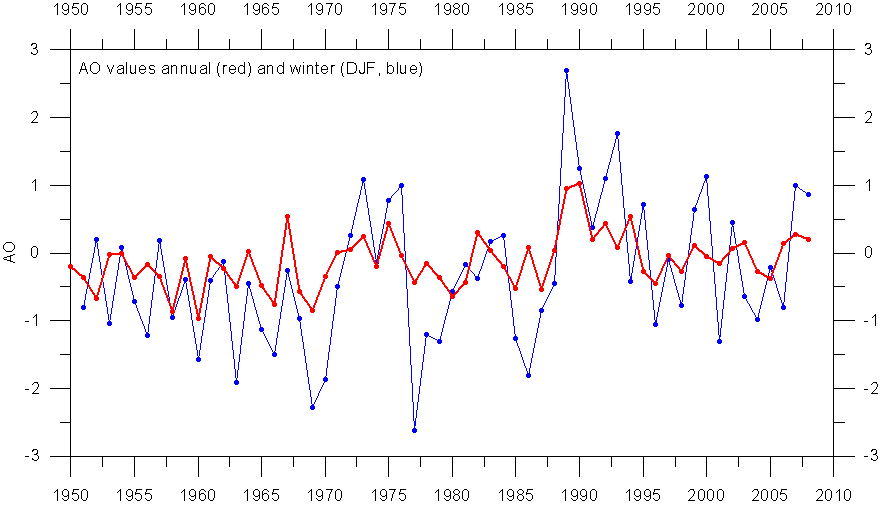
Arctic Oscillation (AO) index values since 1950. Pressure variability for the winter is larger than the annual variability. Following a short peak around 1990, the AO index have again decreased to values near zero. AO data can be downloaded from the Goddard Space Flight Center by clicking here. Last update May 23, 2008.
The Arctic Oscillation (AO) has been recognised by various names for several years, but has become a topic of keen research interest only since 1995. The AO index refers to opposing atmospheric pressure patterns in northern middle and high latitudes (Serreze et al. 1993; Serreze et al. 1995; Serreze and Barry 1998). A band of upper-level winds circulate around the North Pole, forming a vortex. When the vortex increase and the AO index becomes positive, the winds tighten like a noose around the North Pole, locking cold air masses in place near the pole. A weak vortex and a negative AO allow intrusions of cold air masses to plunge southward into North America, Europe and Asia.
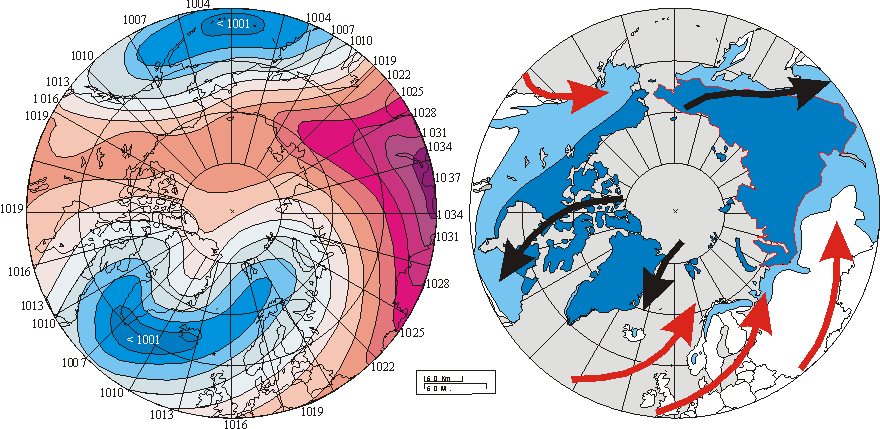
Left diagram shows winter (DJF) sea-level pressure (SLP) averaged over the period 1900-2001. Isobars are spaced every 3 hPa with red colours used for SLP values greater or equal than 1013 hPa and blue colors used for lower values. Numbers at circumference indicate SLP values in hPa. Right diagram shows the modern distribution of permafrost in the Northern Hemisphere. Continuous permafrost is shown by dark blue colour. Discontinuous and sporadic permafrost is shown by light blue color. Red and black arrows show main surface air flow (warm and cold, respectively) as generated by the 20th century pattern of SLP. The overall windsystems set up by the average winter sea-level pressure appears to represent one of several controls on the present distribution of permafrost in the northern hemisphere.
The
Arctic Oscillation thus exhibits a "negative phase" with
relatively high pressure over the polar region and low pressure at midlatitudes
(about 45oN), especially the oceanic mid-latitudes, and a
"positive phase" in which the pattern is reversed. In the positive
phase, higher pressure at midlatitudes drives cyclones farther north toward the
Series of surface atmospheric pressure from the Arctic Ocean is only available from 1950, wherefore the AO index values only is available for a hort period, compared to the NAO index. Updated AO values are shown in the diagram at the top of this section. The red graph in this diagram shows annual values, while the blue graph shows index values calculated for the winter (DJF). The pressure pattern in the northern middle and high latitudes is clearly seen to be much more variable during winter than on an annual basis.
AO data may be downloaded from the Goddard Space Flight Center by clicking here.
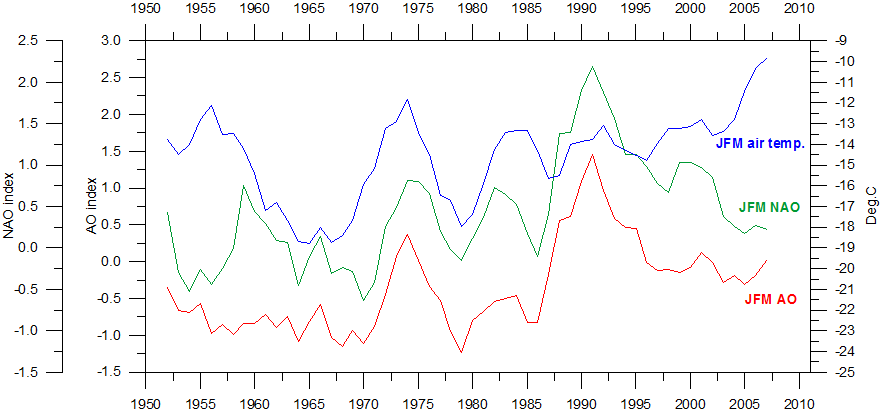
5yr running mean AO and NAO index values calculated for January-March (reference period 1961-1990), compared to 5yr running January-March surface air temperature in Svalbard, since 1950. A certain degree of covariance is visible between the two index values and air temperatures. In general, high AO and NAO values (JFM) tend to correspond to high JFM air temperature in Svalbard, and vice versa. However, the lack of perfect match between the graphs clearly demonstrates that also other factors are important for winter temperatures in Svalbard, especially in the beginning and at the end of the period shown. Last update May 23, 2008.
Click here to jump back to the list of contents.