Oslo UHI experiment, 3 July 2009
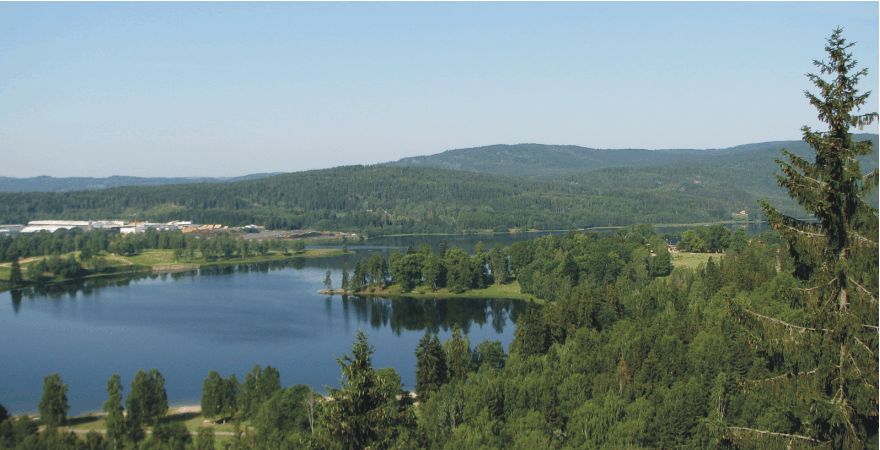
View over Bogstadvannet at the southern end of Sørkedalen, northwestern Oslo, showing the general weather situation 3 July 2009.
The general weather
situation, measurement equipment and measurement route
The sky was clear, with no clouds. Wind was southwesterly and light, about 1-2 m/s. Air temperatures was high, 27-28oC. A thermistor mounted inside a radiation shield was attached to the top of a car (c. 1.5 m above terrain), to minimize local heating effects from the vehicle, and the air temperature were logged at 2 sec. intervals. The time given in the diagrams below are according to local summer time. The measurements were carried out for two routes, RUN 1 and RUN 2, each passing through the city of Oslo, but beginning and ending in the open, rural landscape outside the city:
-
Starting in upper Sørkedalen northwest of Oslo, driving through southern Oslo, and ending northeast of Oslo.
-
The opposite route, but passing through northern Oslo, thereby passing within 100 m of the meteorological observation site of the Norwegian Meteorological Institute.
The
geographical location of the two measurement routes is shown in the map below. Oslo
is the capital of
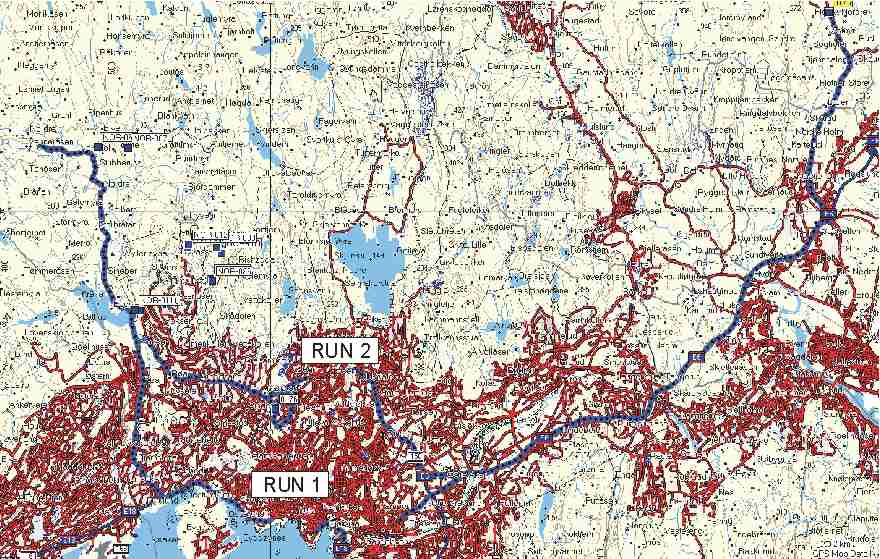
Map showing location of the two measurement runs. RUN 1 is the southern route from west towards east, while RUN 2 is the northern route from east towards west. The map measures 30 km from west to east. The altitude ranges from about 150 and 180 m asl., at the western and eastern endpoint, respectively, and about 5 m asl. near the coast.
Results
Run 1. Starting in open landscape in upper Sørkedalen, passing through southern Oslo, and ending in open landscape northeast of Oslo. Local summer time is shown along the x-axis. See map above for measurement route.
Run 2. Starting in open landscape northeast of Oslo, passing through northern Oslo, and ending in open landscape at the head of Sørkedalen. Local summer time is shown along the x-axis. See map above for measurement route.
Interpretation
Both measurement routes (RUN 1 and RUN 2) demonstrate the existence of a urban heating effect of the city of Oslo. Generally speaking, at the time of measurement, air temperatures inside Oslo was about 2oC higher than in the open landscape on either side of the city. The wind was light from southwesterly direction, which explains the relatively cool areas registered inside Oslo during RUN 1. Whenever the measurement route was near the coast and exposed to onshore winds, the cooling effect of the sea is seen. This is not demonstrated to the same degree by RUN 2, which is following a measurement track several kilometres inland. At the time of measurement, the official meteorological station at Blindern is not noteworthy affected by the Oslo urban heat effect.
Click here to jump back to the Urban Heat Island main page with additional examples.