Longyearbyen Solar Eclipse, August 1, 2008
Longyearbyen 1
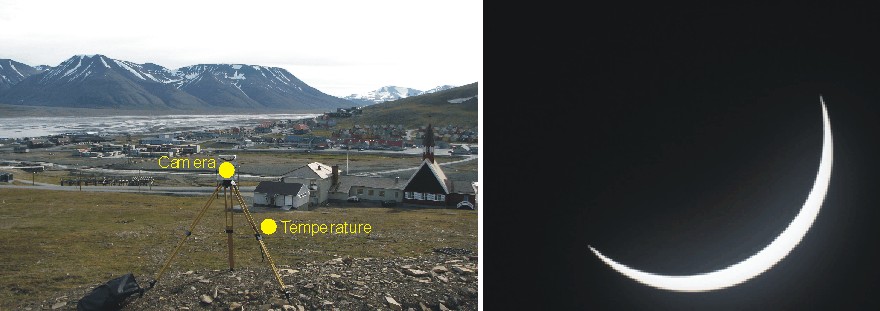
August 2008 09:30 hr, showing instrument setup with automatic camera and
temperature measurements at terrain surface and 130 cm above the surface,
respectively (left). The sun seen from Longyearbyen at the maximum eclipse (93%)
at
General
Om
1 August 2008, between
-
Click here to read about the background for the solar eclipse and to see map with path of the eclipse.
-
Click here to read more about the solar eclipse in Longyearbyen.
-
Click here to see image from Kvitøya (Northeast Svalbard) of the full solar eclipse.
-
Click here to see a list of previous solar eclipses.
Solar eclipses have no real effect on global climate, but nicely illustrates the meteorological significance of variations in solar radiation. In Longyearbyen, before the onset of the eclipse, the weather was partially overcast with thin, high clouds, the wind was from northwest, about 3-4 m/s, and the air temperature was about 10.5oC. During the eclipse, the cloud cover gradually decreased somewhat.
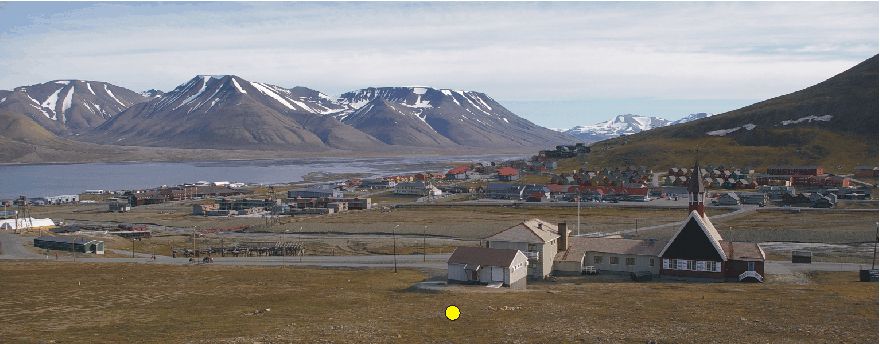
An automatic camera was mounted on a tripod, overlooking Longyearbyen in easterly direction (photo above). About 70 m in front of the camera two thermistors were installed at the ground surface and 130 cm above the surface, respectively. Temperatures were logged at 5 sec interval. The measurement site was located about 1 kilometre inland (see map below). A couple of the photos obtained are shown below.
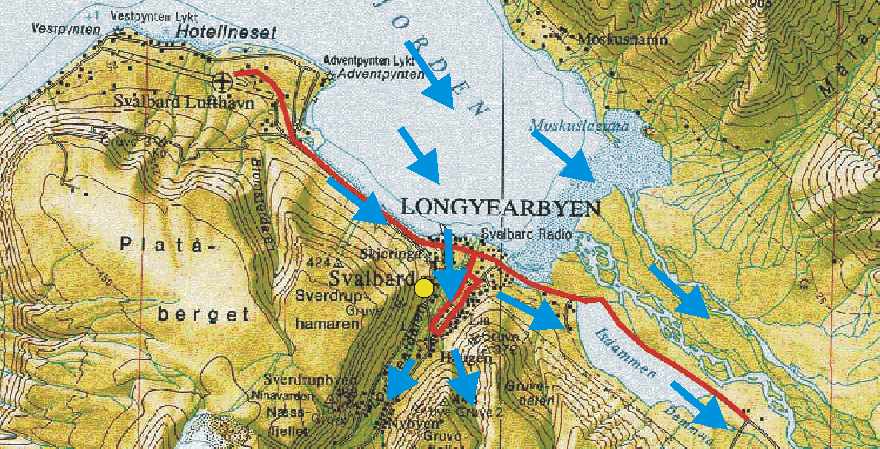
Map showing Longyearbyen and the measurement site (yellow dot) on 1 August 2008. The blue arrows show the direction of the air flow at the onset of the solar eclipse.
Observations
during the solar eclipse
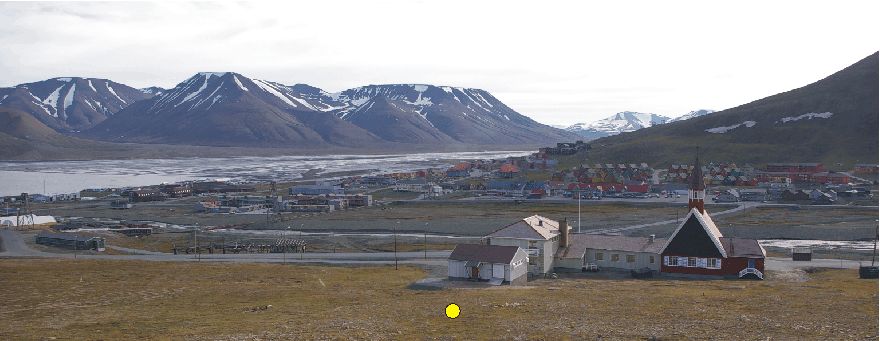
Longyearbyen and Adventdalen valley looking east at 10:27, 12 minutes before the onset of the solar eclipse. The yellow dot show the position of the two thermistors. Photo taken using shutter speed 1/650 sec.
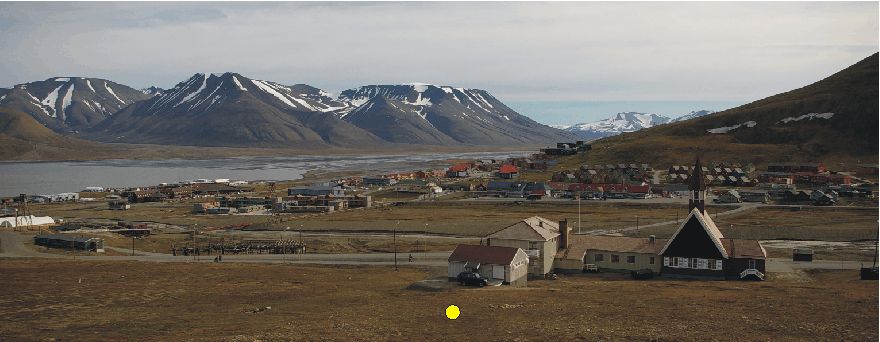
Longyearbyen and Adventdalen valley looking east at 11:41, at the maximum solar eclipse (93%). The yellow dot show the position of the two thermistors. Photo taken using shutter speed 1/60 sec.
Longyearbyen and Adventdalen valley looking east at 12:49, 6 minutes after the end of the solar eclipse. The yellow dot show the position of the two thermistors. Photo taken using shutter speed 1/650 sec.
During the eclipse the light intensity was visibly reduced, although shaddows still were generated. The reduced light intensity is not clearly visible from the photos above, which was taken using the automatic camera settings. The change in shutter speed, from 1/650 sec to 1/60, however, illustrates the effect of the reduced light. At the nearby kindergarten, the automatic outdoor light came on during the maximum eclipse (see photo below).
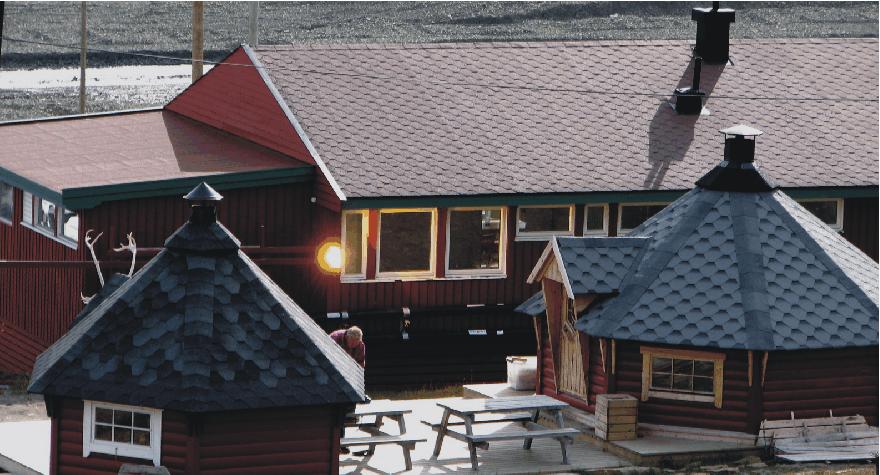
Kindergarden with automatic outdoor light turned on at the maximum solar eclipse 11:41 hr.
Air
and ground surface temperatures during the solar eclipse
The air temperature was measured 130 cm above the terrain surface (logged at 5 sec interval) initially varied from 10.2 to 10.8oC, depending on cloud cover and wind speed (see diagram below). For half an hour (c. 10:15-10:45) a somewhat thicker cloud cover caused air temperatures to decrease to about 10.1-10.5oC.
Diagram showing air temperatures 130 cm above the ground surface before, during, and after the solar eclipse. The wind speed and -direction is given in the grey bottom panel. Temperatures were recorded at 5 sec intervals.
The temperature effect of the solar eclipse is clearly visible from about 11:14 hr, and lasts until about 11:53. During the eclipse the air temperature decreases from c. 10.8 to c. 9.4oC. At the same time the wind speed decreases, and for a 15 min period around the maximum eclipse calm conditions prevailed at the measurement site. This was presumably caused by reduced heating of snow-free ground surfaces further inland, which normally tends to generate onshore winds during the summertime. As the heating was reduced during the solar eclipse, so was the onshore flow of air masses from the nearby fjord. For a short period the calm period was actually followed at the measurement site by downvalley katabatic vind from the SSW (two glaciers are located at the valley head). From around 12:15, however, the initial wind system with onshore wind from NNE was reestablished in concert with increasing inland heating of snow-free ground. The temperature variations caused by the solar eclipse were even more pronounced for the ground surface temperature, as is shown in the diagram below.
Diagram showing both ground surface and air temperatures before, during, and after the solar eclipse. The wind speed and -direction is given in the grey bottom panel. The temperature variations measured at the ground surface (red graph) is considerably larger than the air temperature variations (blue graph). The ground surface temperature decrease during the eclipse is about 14oC, compared to the 1.4oC decreases in air temperature. The ground surface was covered by 1-2 cm high plants at the measurement site. Temperatures were recorded at 5 sec intervals.
Click here to see an example of detailed meteorological observations made during the total solar eclipse in Luxemburg 11 August 1999 (by courtesy of Dr. Francis Massen).
Click here to jump back to main urban heat island page