Longyearbyen UHI experiment 22 June 2009
Open Climate4you homepage
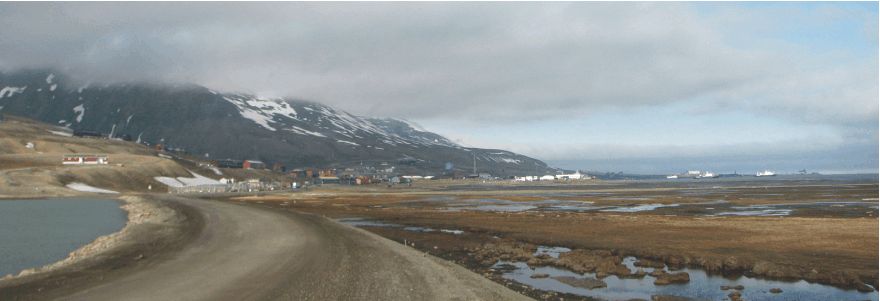
Longyearbyen 22 June
2009 09:22 hr (summer time), looking WNW from the northern end of
the lake Isdammen (see map below). The sky was partly overcast, especially along
mountain slopes. The wind
was from NW, 3-6 m/s. The large building in the
distance to the right (between the ships) is the main hangar at Svalbard Airport. Compare with map below.
The general weather
situation, measurement equipment and measurement route
The air temperature was about 3.5oC, and the wind from NW, 3-6 m/s (see map below). The sky was partially overcast, with most clouds forming along mountain slopes. Cloud base was around 400 m asl. The ground was covered by snow above 2-400 m asl., and the nearby fjord was ice free (see photo above). A shielded thermistor was attached to the roof of a car (c. 1.5 m above terrain), and temperatures were logged at 2 sec. intervals. The time given in the diagrams below are using local summer time (true solar noon at about 13 hr). The measurements were carried starting at Svalbard Airport in the upper left of the map below, driving southeast along the coast to the town, making a round tour here, before proceeding inland into the lower part of the large valley Adventdalen.
Longyearbyen
is the worlds northernmost town and is located at 78o17'N 11o20'E,
in central
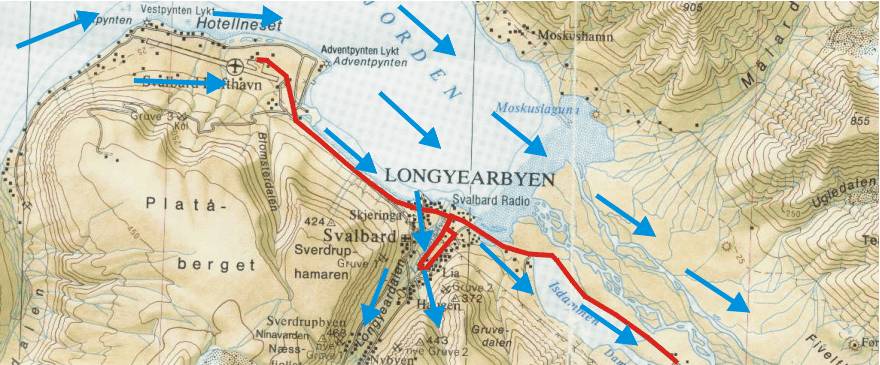
Topographic map showing Longyearbyen and Svalbard Airport (Svalbard Lufthavn). The red line shows the measurement route 22 June 2009, starting at the Airport (location of the official meteorological station) and ending in the lower part of the valley Adventdalen to the SE. In between, a detour was made in the central part of the town as shown. The wind was from NW, 3-6 m/s (blue arrows). The fjord was ice free. The map section measures c. 13 km west to east.
Results
Result
of temperature measurements along the route Svalbard Airport - Longyearbyen
-Adventdalen, 22 June 2009. The official Svalbard meteorological station is
located at the airport. Se map above for reference.
Interpretation of results
The landscape was
snow covered above 2-400 m asl., and the nearby fjord was ice free. The route was
in shade from clouds.
At the airport, the
general air temperature was about 6oC. Leaving the airport,
the air temperature drops to about 4oC. The local temperature minimum
of about 3oC was recorded in lower Longyear valley, presumably caused
by cold onshore winds.
In central Longyearbyen, the temperature again increased to about 4oC.
Travelling inland along Adventdalen, air temperature varied between 3 and 4oC,
being controlled by onshore winds chilled by the cold fjord surface.
The temperature peak (6oC) at the airport is interpreted as the result of the air masses being heated by passing 2-3 km snow free terrain before reaching the airport (see map above). The remaining part of the measurement route was within air masses cooled by the nearby fjord. In central Longyearbyen a small urban heat island effect may have been recorded, about 1oC, but this may also be due to chance. Further inland in Adventdalen the air temperature again was lower, as the effect of cold onshore air flow was dominating. At the inland end of the measurement route the air temperature was rising to 4.6oC, perhaps an indication of a beginning inland warming of the relatively cold onshore winds. However, the measurement route is to short to draw firm conclusions on this.
Summing up, the local temperature effect of onshore versus offshore winds appears to be about 2oC in the coastal areas of central Spitsbergen on this particular day.
Click here to jump back to main urban heat island page.