Longyearbyen UHI experiment 2 May 2010
Open Climate4you homepage
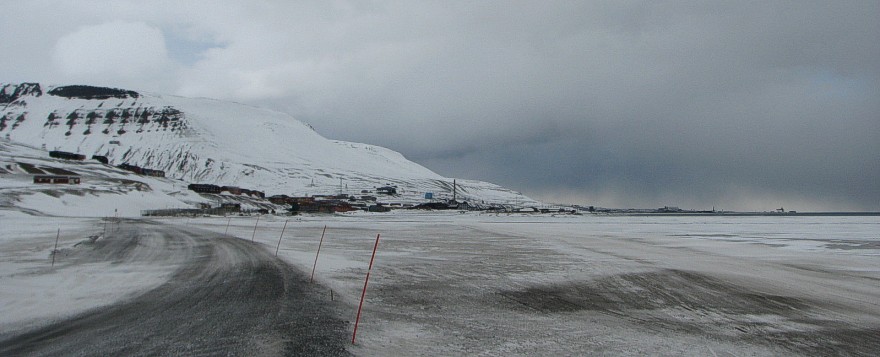
Longyearbyen 2 May
2010 12:11 hr (summer time), looking WNW from the northern end of
the lake Isdammen (see map below). The sky was overcast, and it was just
beginning to snow. The wind
was from SE, 8-10 m/s. The large building in the
distance to the right (between the ships) is the main hangar at Svalbard Airport. Compare with map below.
The general weather
situation, measurement equipment and measurement route
The air temperature was about -1.5oC, and the wind from SE, 8-10 m/s (see map below). The sky was overcast, with a frontal system moving in and snow just beginning to fall. The cloud base was around 4-500 m asl. The ground was covered by snow, and the nearby fjord was almost ice free (see photo above). A shielded thermistor was attached to the roof of a car (c. 1.5 m above terrain), and temperatures were logged at 2 sec. intervals. The time given in the diagrams below are using local summer time (true solar noon at about 13 hr). The measurements were carried starting at Svalbard Airport in the upper left of the map below, driving southeast along the coast to the town, making a round tour here, before proceeding inland into the lower part of the large valley Adventdalen.
Longyearbyen
is the worlds northernmost town and is located at 78o17'N 11o20'E,
in central
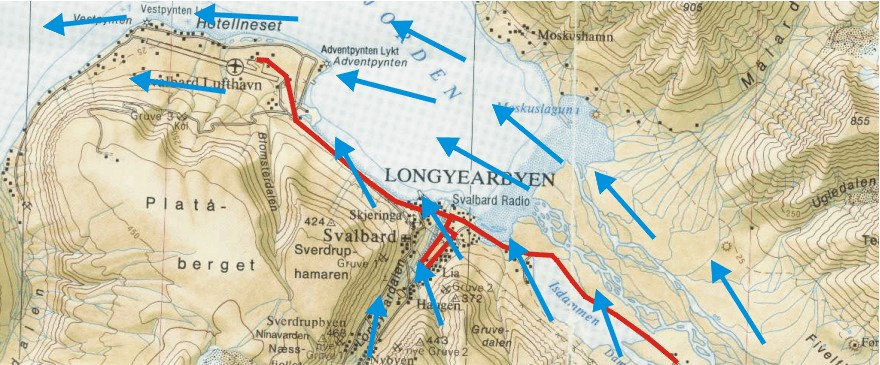
Topographic map showing Longyearbyen and Svalbard Airport (Svalbard Lufthavn). The red line shows the measurement route 2 May 2010, starting at the Airport (location of the official meteorological station) and ending in the lower part of the valley Adventdalen to the SE. In between, a detour was made in the central part of the town as shown. The wind was from SE, 8-10 m/s (blue arrows). The fjord was ice free, except for a 2-300 m zone with ice along the southern shore. The map section measures c. 13 km west to east.
Results
Result
of temperature measurements along the route Svalbard Airport - Longyearbyen
-Adventdalen, 2 May 2010. The official Svalbard meteorological station is
located at the airport. Se map above for reference.
Interpretation of results
The landscape was
snow covered, and the nearby fjord was almost ice free. The route was
in shade from clouds.
At the airport, the general air temperature was about -1.0oC. Leaving the airport, the air temperature initially increased to about -0.6oC, before descending to about -1.0oC. In central Longyearbyen a local temperature maximum of about -0.6oC was recorded. Leaving Longyearbyen and travelling inland along Adventdalen, air temperature decreased to about -2oC, before again increasing to about -1.3oC.
The relatively high air temperatures recorded at the airport is interpreted as the result of the air masses being heated by flowing across 3-4 km ice free ocean surface before reaching the airport (see map above). The remaining part of the measurement route was within air masses flowing from snow covered inland areas, without local warming influence of ice free water. In central Longyearbyen a small urban heat island effect (0.5-0.7oC) may have been recorded, but this may also be due to chance. Further inland in Adventdalen the air temperature generally was 0.5-1oC lower than at the airport and the official meteorological station, as the effect of air flow from the interior of Spitsbergen was dominating.
Summing up, the local temperature effect of onshore versus offshore winds appears to be about 0.5-1oC in the coastal areas of central Spitsbergen on this particular day. The Longyearbyen urban heat island effect was about 0.5-0.7oC.
Click here to jump back to main urban heat island page.