Permafrost
Open Climate4you homepage
Map showing extension of the modern northern hemisphere permafrost
Modern extension and type of permafrost in the northern hemisphere according to the International Permafrost Association (IPA). The different colours indicate different types of permafrost, ice content, etc. Click here for a larger map.
Click here to jump back to the list of contents.
Air temperature (upper panel) at 3 m height and ground temperature (lower panel) at the surface, and at 1, 2, 3, 4 and 5 m depth on the summit plateau of Gruvefjellet (78.25oN,15.55oE, 464 m asl.), central Spitsbergen, Svalbard. The permafrost data series (hourly values) start on 3 March 2008. Please note that the two temperature scales in the two panels are not identical. The air temperature typically reaches maximum values around mid July, while the permafrost temperature reaches their maximum later, at 5 m depth around mid November. This time delay of almost 4 months is caused by the time required for heat conduction from the surface to 5 m depth. The Gruvefjellet permafrost station is operated by the Geology Department at the University Centre in Svalbard (UNIS), and is part of the permafrost research project TSP-Norway (Thermal State of Permafrost in Norway and Svalbard). See photo of station below. Last day shown: 6 September 2021.
-
Click here to download the entire data series from the Gruvefjellet station. The meteorological data series begins 30 November 2006, but the 5 m deep borehole with ground temperature recording only became operational from 3 March 2008.
-
Click here to see permafrost temperatures at different depths in the borehole for the last year.
-
Click here to see permafrost temperatures more detailed for the last month.
-
Click here to see present meteorological conditions at the Gruvefjellet station.
Wind direction and -speed at 3 m height on the summit plateau of Gruvefjellet (78.25oN,15.55oE, 464 m asl.), central Spitsbergen, Svalbard. The Gruvefjellet permafrost station is operated by the Geology Department at the University Centre in Svalbard (UNIS), and is part of the permafrost research project TSP-Norway (Thermal State of Permafrost in Norway and Svalbard). See photo of station below. Wind direction and -speed is important for snow redistribution and therefore also for ground temperatures. Last day included in analysis: 6 September 2020.
-
Click here to download the entire data series from the Gruvefjellet station. The meteorological data series begins 30 November 2006, but the 5 m deep borehole with ground temperature recording only became operational from 3 March 2008.
-
Click here to see present meteorological conditions at the Gruvefjellet station.
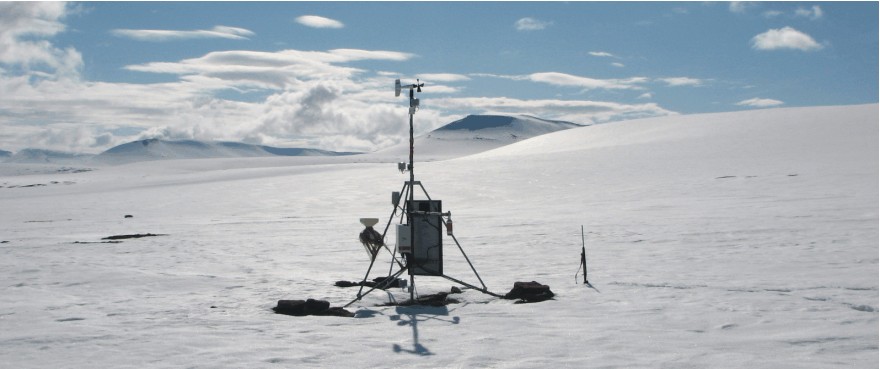
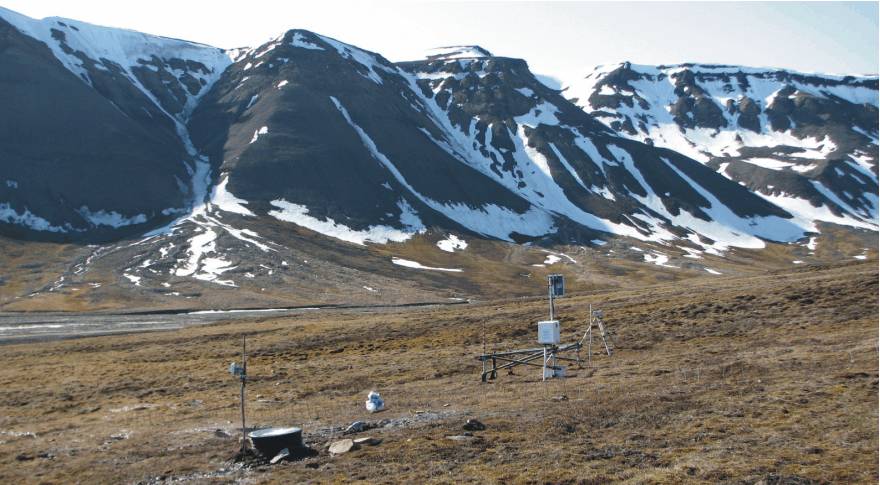
Gruvefjellet meteorological station 20 June 2009, 464 m asl. The borehole with ground temperature thermistors is located close to the rifle to the right of the station.
Permafrost research is a young branch of science, and very few permafrost temperatures are found online. At the moment, permafrost data from Gruvefjellet (photo and diagram above) and the nearby Endalen permafrost station (see below) are presumably the only two permafrost sites with online data available.
Ground temperatures at the Endalen permafrost station (50 m asl.) in central Spitsbergen, Svalbard. Ground temperatures have been recorded in a 19 m deep borehole since 16 September 2008. This station is also operated by the Geology Department at the University Centre in Svalbard (UNIS), and is part of the permafrost research project TSP-Norway (Thermal State of Permafrost in Norway and Svalbard). See photo of station below. Last day shown: 30 April 2016. Last diagram update: 8 May 2016.
-
Click here to download the entire data series from the Endalen permafrost station since 16 September 2008. Then click on 'ENDALEN_PERMAFROST' in the left hand panel.
-
Click here to see other diagrams displaying permafrost temperatures at the Endalen permafrost borehole. Then click on 'ENDALEN_PERMAFROST' in the left hand panel.
Permafrost borehole (left foreground) in lower Endalen, central Spitsbergen. The other installations relate to measurements of ground resistivity, soil creep (solifluction) and automatic digital photography. 21 June 2009, looking south.
Ground and permafrost temperatures are important for evaluating the snow avalanche risk in high relief areas, such as Svalbard. Click here to obtain more information on the CRYOSLOPE SVALBARD snow avalanche research project, including past and present observations on avalanche activity in the Longyearbyen region.
Svalbard has the longest meteorological record (since 1912) from the high Arctic. Click here to see the complete meteorological record from Svalbard. Click here and here to see examples of the influence of sea ice and urban heat island effects on recorded air temperatures in Svalbard and around the main settlement Longyearbyen.
Click here to jump back to the list of contents.
Permafrost or perennially frozen ground is defined as ground which remains at or below 0°C for at least two consecutive years. In the Northern Hemisphere, the permafrost regions occupy approximately 23 million square kilometres (24%), with actual permafrost areas underlying between an estimated 12 and 17 million square kilometres, or approximately 12 to 18 % of the exposed land area (areas beneath ice sheets and ice caps are not included in this estimate), principally at high latitudes. In the Southern Hemisphere, permafrost underlies some 100 to 150 thousand square kilometres in the mountains of South America, and an estimated 49 thousand square kilometres beneath ice-free land south of 60oS latitude. A key characteristic of permafrost is the presence of ice in the ground, although the definition of permafrost do not require ice to be present in permafrost. The ice in permafrost occurs in a variety of forms and often in large masses of relatively pure ice.
Permafrost is overlain by a seasonally unfrozen layer, the active layer, which is not part of the permafrost itself.
The presence of permafrost is a primary factor
hydrologically distinguishing
It should be borne in mind, however, that any air temperature change is likely to be associated with other changes, e.g. in cloud cover, wind, precipitation, snow cover timing and -thickness, having effects on geomorphological activity (erosion vs. deposition) and vegetation. Such effects may well be able to either enhanche or cancel out the isolated effect of air temperature change.
Permafrost affects a wide range of landscapes and ecosystems, and issues related to hazards and engineering construction work. Because of this broad interest, most permafrost research initiatives are coordinated and results communicated by the International Permafrost Association (IPA), with has members from all nations with permafrost research interest in Arctic, Antarctic or Alpine environments.
Existing permafrost temperature records are still short (see diagram below), and the relation between air temperature, wind speed, snow cover, etc, still subject to scientific investigations. In general, however, there is little doubt that ground temperatures in the uppermost layers of permafrost tend to follow changes of air temperatures, especially when seen over a period of 3-5 years, or longer, and especially at windswept sites.
Global simple running 37 month average surface air temperature since 1979 according to Hadley CRUT, a cooperative effort between the Hadley Centre for Climate Prediction and Research and the University of East Anglia's Climatic Research Unit (CRU), UK. Insert shows a number of selected long permafrost temperature series, obtained at shallow depth (Koç et al. 2009). The length of existing permafrost temperature series is still short, compared to meteorological air temperature series. Please note that the permafrost temperature diagram uses two different temperature scales, both different from that used for air temperatures. Base period for HadCRUT3: 1961-1990. Last month shown in HadCRUT3: October 2009. Latest diagram update: 16 December 2009.
Click here to jump back to the list of contents.
20th century permafrost and climate
Permafrost temperatures are occasionally described simplistic as being more or less controlled by variations in air temperatures. In reality, however, the situation is far more complex. Especially the timing, duration and thickness of the winter snow cover may have large effects on permafrost temperatures. In addition, changes in vegetation may also have influence. How air temperature and winter snow cover have changed in the Arctic during the 20th century are indicated by the diagrams in the table below.
| Period | Precipitation annually | Precipitation warm season | Precipitation cold season |
Temperature annually |
Temperature warm season | Temperature cold season | Ground temperature | Snow mass balance |
| 1901-1910 |  |
 |
 |
 |
 |
 |
 |
 |
| 1911-1920 |  |
 |
 |
 |
 |
 |
 |
 |
| 1921-1930 |  |
 |
 |
 |
 |
 |
 |
 |
| 1931-1940 |  |
 |
 |
 |
 |
 |
 |
 |
| 1941-1950 |  |
 |
 |
 |
 |
 |
 |
 |
| 1951-1960 |  |
 |
 |
 |
 |
 |
 |
 |
| 1961-1970 |  |
 |
 |
 |
 |
 |
 |
 |
| 1971-1980 |  |
 |
 |
 |
 |
 |
 |
 |
| 1981-1990 |  |
 |
 |
 |
 |
 |
 |
 |
| 1991-2000 |  |
 |
 |
 |
 |
 |
 |
 |
Spatial distribution of decadal annual precipitation, surface air temperature, estimated ground temperature, and estimated snow mass balance in areas north of 50oN, in relation to the average for the 20th century. The diagrams in the column labelled "Ground temperature" provide direct indication of decadal temperature change in ground temperatures, in relation to average 20thy century conditions. In permafrost areas (map at top of page), this corresponds to temperature changes in the topmost part of the permafrost, beneath the active layer. The significance of the colours used is described in the text below, and is also indicated in the individual diagrams by a scale. The time range is indicated by a number: 1 = January, 2 = February, etc. Click on the individual small diagrams to open full-size diagrams north of 50oN. Similar temperature diagrams showing both polar regions since 2005 can be seen by clicking here. Data source: NASA Goddard Institute for Space Studies (GISS).
In the table above with clickable maps the decadal temperature and precipitation is compared to the average conditions for the whole 20th century, to indicate likely changes in ground and permafrost temperatures.
In the precipitation
diagrams (column 2-4) yellow-red colours indicate less precipitation than what
was the average for the
20th century, while blue colours indicate higher precipitation than the average.
During the cold season, when much of the precipitation falls in the form of snow, precipitation records may underestimate
the real amount of precipitation, because of under catch by precipitation gauges.
Measuring solid precipitation correctly is still a major meteorological problem, and it is very
likely that the real amount of winter precipitation is higher than shown in the
diagrams below.
To
analyse the effect on ground and permafrost temperatures, induced by changes in air temperatures and precipitation,
a series of maps
showing the decadal temperature changes are shown in column 5-7, displaying
decadal conditions
compared to the average 20th century conditions. Warm colours indicates areas
with higher temperature during the decade considered than the 20th century
average, while blue colours indicate lower than average temperatures.
The
two rightmost columns (8+9) show the calculated large-scale effects on ground
temperatures and net accumulation of snow (~ glacier mass balance). These
diagrams, because of the scale used, ignore all local effects on snow cover and
insolation derived from wind, topography and vegetation. They should therefore not be over-interpreted as to
their detail.
In
the ground temperature column (column 8) MAGST is short for mean annual ground surface
temperature
In
the snow mass balance column (column 9) warm colours indicate areas where seasonal snow
will tend to disappear early in the year during the decade considered, compared to average 20th century
conditions. Blue colours
indicate areas where the seasonal snow cover will disappear later in the year than average 20th century
conditions. For areas
with glaciers, these two criterions correspond to below-average and
above-average glacier mass balance compared to average 20th century conditions,
respectively. The snow mass balance change is calculated by considering the
corresponding changes in cold season precipitation and warm season air
temperatures. Higher cold season precipitation (snow) will tend to improve the
overall annual mass balance, while higher warm season air temperatures will lead
to increased melting of snow and ice, and thereby have the opposite effect. A
degree-day factor of 3.8 mm w.e. has been used in the calculations of summer
ablation (melt and evaporation). As mentioned above, neither this nor the
neighbouring ground temperature diagram should be over interpreted with regard
to their details.
The complexity of climatic change during the 20th century is apparent from the diagrams above. Some Arctic regions may become wetter, while other nearby simultaneously become more arid (dry). Some may become warmer, while other nearby simultaneously become cooler. Clearly the configuration of jet streams and local wind conditions by orographic effects often exercise the main control on the amount of recorded precipitation changes at individual sites (column 2-4), while the influence of air temperature is smaller. At the same time, there is a overall tendency to relatively low precipitation at many sites until the end of the Little Ice Age in the early 20th century, perhaps associated with low air temperatures. On the other hand, the cooling period 1941-1980 appears to have been characterized by generally increasing precipitation in many regions north of 50oN, which is in contrast to what would be expected from the air temperature change. Following the general late 20th warming (here: after 1981), precipitation apparently has continued the overall, slow increase. It remains to be investigated how much of the apparent 20th precipitation increase (both during warming and cooling periods) are the result of gradually improved technology to measure precipitation.
The ground thermal diagrams
(column
8) confirm the general tendency of increasing temperatures in the topmost part
of permafrost, as recently documented from several Arctic regions. It is however
also clearly seen, that the available 1-15 years of observations on permafrost
temperatures only represent very short data series, without long-term
significance. As an example, the ground temperature
diagrams give reason to believe that presently rising permafrost temperatures in
Alaska and parts of
The snow mass balance diagrams
(column
9) indicate the overall conditions for snow survival during the summer, and
thereby provides indications for the size of perennial snow fields. In addition,
these diagrams reveal several geographical features documented by observed glacier
variations and glaciological mass balance investigations. As one example, many
glaciers in the
Click here to jump back to the list of contents.
Permafrost literature for download
Since 1966 the International Permafrost Association (IPA) has organized international conferences on permafrost. The latest conference, the Ninth International Conference on Permafrost, was held in Fairbanks, Alaska, June 29 - July 3, 2008.
-
Click here to download one or all of the proceedings from permafrost conferences since 1966 (free).
-
Click here to purchase the printed version of proceedings from one or all permafrost conferences since 1966.
Click here to jump back to the list of contents.