Climate in Europe now and during the 20th century
Open Climate4you homepage
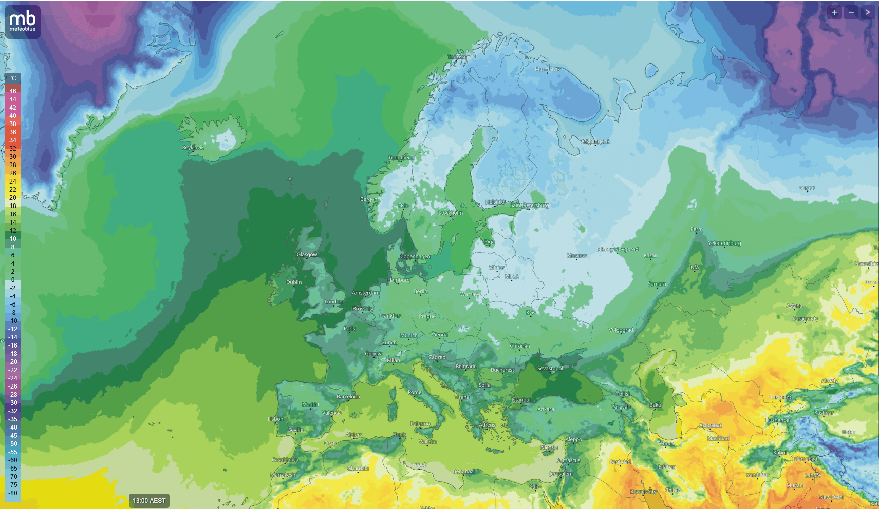
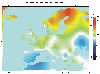
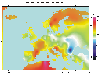
Surface air temperatures in Europe 27 April 2025 by courtesy of www.meteoblue.com. Temperature is indicated by the colours (degrees Celcius; scale to the left). Click here or here to check for a more updated version or to play an animated sequence showing the forecasted weather the next five days .
Click here to jump back to the list of contents.
In contrast to
North and

Map showing main topographical features in Europe.
In the Northern Hemisphere, summer insolation peaked 10-9 ka BP, when the last remnants of the large ice sheets in the northern hemisphere retreated rapidly. Incoming solar radiation was approximately 40W/m2 higher then than now (Berger and Loutre 1991). Since then the Northern Hemisphere summers have gradually seen decreasing incoming solar radiation. This has been important, especially for high latitudes during summer when daylight persists for 24 hours (Bradley 1990). In much of the Nordic Seas the subsequent mid Holocene period 5–4 ka BP encompasses a transition to reduced Atlantic Water influence and lower sea surface temperatures (e.g., Koç et al. 1993). The late Holocene was punctuated by a number of 400-800 yr periods with either relatively warm or cold climate, such as e.g. the Medieval Warm Period (MWP; c. AD 800-1200) or the Little Ice Age (LIA; c. AD 1300-1900).
Here we focus on climate in Europe during the 20th century. This has been a period of recovery after the Little Ice Age, ending in the late 19th century in central Europe and in the early 20th century in northern Europe. Temperatures have generally been increasing, but not in a uniform manner. Very generally temperatures were increasing until around 1940, decreasing until 1975, and increasing since then. This overall 20th century climatic development is reflected in many regions of Europe, but not all, as will be seen from the diagrams below.
For practical purposes, the 20th century has been divided into three
periods: 1900-1935, 1935-1975, and 1975-2000. The analysis is based on data from
318 meteorological stations distributed across
Click here to jump back to the list of contents.
Diagram table showing surface air temperature changes in Europe during the 20th century
|
Period |
DJF |
MAM |
JJA |
SON |
YEAR |
|
1900-1935 |
|
|
|
|
|
|
1935-1975 |
|
|
|
|
|
|
1975-2000 |
|
|
|
|
|


DJF = December-Februar (winter), MAM = March-May (spring), JJA = June-August (summer), SON = September-Novemver (authumn), and YEAR = January-December. Click on the individual small diagrams to open full-size diagrams. Data source: NASA Goddard Institute for Space Studies (GISS).
One immediate result of this visual analysis is that even a relatively small land area as Europe display large regional differences in time and space with respect to ongoing climatic change. During the short instrumental period all regions of Europe has experienced a variety of surface air temperature changes, sometimes in concert with changes in other parts of the continent, but often in contrast to contemporary changes in even nearby regions. Also the seasonal variations is considerable. Presumably, it is difficult to find a meteorological station representative for more than just local conditions. Calculation of an the average surface air temperature change for Europe during the 20th century is entirely possible from a mathematical point of view, but gives only little practical meaning. Climate change clearly have to be analysed and understood on a regional scale. Values calculated on a continental, hemispheric or even global scale, only gives little useful information on the regional scale.
For an analysis of 20th century changes in precipitation and air temperature north of 50oN click here.
For an update on present meteorological conditions in Europe, click here.
All diagrams were prepared using gridded data downloaded from various databases and meteorological stations. For surface interpolation of the gridded data a kriging algorithm was used, plotting all stations in a polar projection map. The kriging procedure attempts to express trends and is widely considered one of the more flexible interpolation methods, producing a smooth map with few ‘bull eyes’. It is usually recommended for gridding almost any type of data set, especially data sets with a heterogeneous point distribution, such as characterising the present data set. Some bulls eyes may remain in the diagrams, indicating real, local temperature deviations due to, e.g., urban heat island or inversion effects. The geographical location of the 318 meteorological stations used in the present analysis is shown in the diagram below.
Click here to jump back to the list of contents.
Meteorological stations used in the analysis
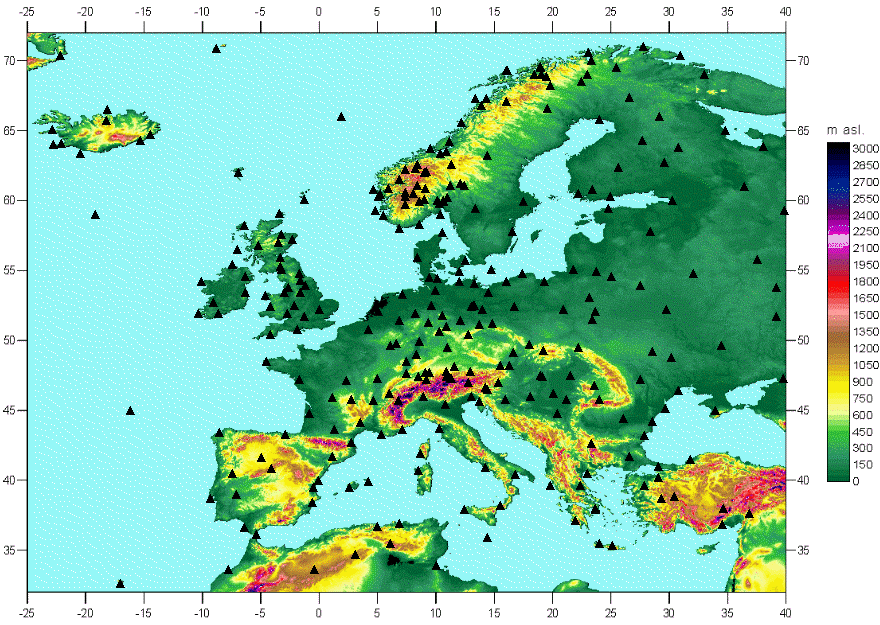
Map showing the geographical location of meteorological stations used to prepare the diagrams accessible from the table above.
Click here to jump back to the list of contents.